
Business Intelligence (BI) and Cloud BI in 2023: What, Why and How
With business operations becoming more and more complex and challenging in today’s world, the need for easy-to-access
business intelligence becomes critical for fast decision-making so your company can function smoothly and remain competitive.
Business Intelligence (BI) has been a buzzword for some time now, and every organization has been trying to implement tools and
software
that helps to process large amounts of data and present it in an easy-to-consume visual format on an integrated dashboard.
Initially, business intelligence tools were installed and operated locally, in a company’s offices. However, with the
increasing prevalence of remote and decentralised teams, field executives who often need access to data on-the-go, and
a wide range of devices and applications in use in different processes, the need to shift these tools to the cloud is
the need of the hour.
In 2023, when we talk about BI implementation, we’ll also need to factor in the concept of Cloud BI.Cloud BI offers
flexibility and long-term cost advantages to your company’s data analytics processes, with the added benefit of eliminating
the need for a lot of cumbersome physical hardware.
Components of Business Intelligence (BI):
Before we deep dive into Cloud BI implementation, let’s take a look at the components of Business Intelligence (BI):
There are 5 major components of BI.
-
Online Analytical Process: OLAP implements the multidimensional analysis process that enables users to easily and selectively extract and query data in overdose it from different point points.
-
Corporate Performance Management:CPM is a subset of Business Intelligence that involves monitor and managing the business intelligence of a company according to key performance indicators.
-
Real-Time Business Intelligence: RTB is the combination of data analyzing and data processing with accurate time.
-
Data Ware Housing:A data warehouse is a database that is designed for storing and analyzing huge volumes of data. Data warehouses are used by businesses to store their data in a single location so that it can easily be accessed and analyzed.
-
Data Sources:In general databases are the most traditional type of data source in business intelligence, like MS Access, Oracle, DB2, SQL, MYSQL, Amazon sample database, etc.
In some other cases, organizations may use an ETL tool to collect data from their traditional databases, then transform them for business intelligence and load them into the warehouse or data mart.
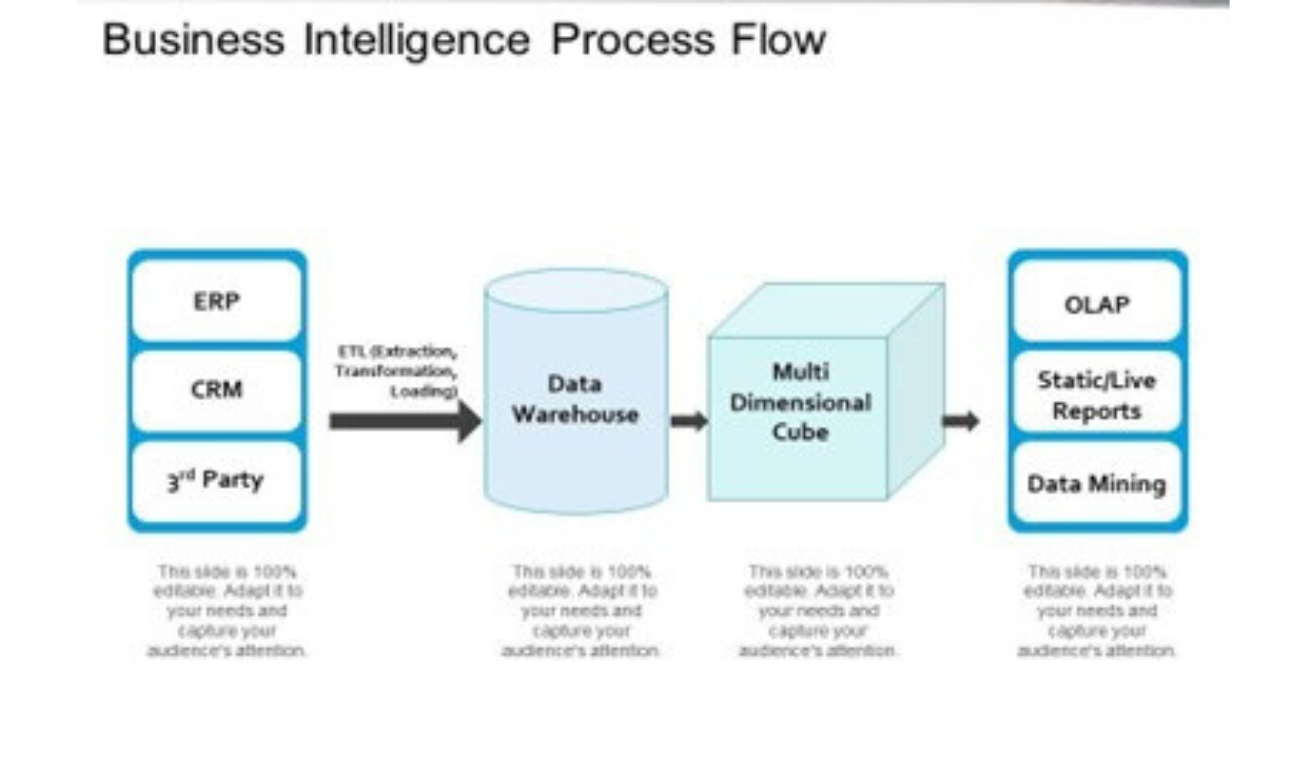
A typical BI process flow looks something like this:
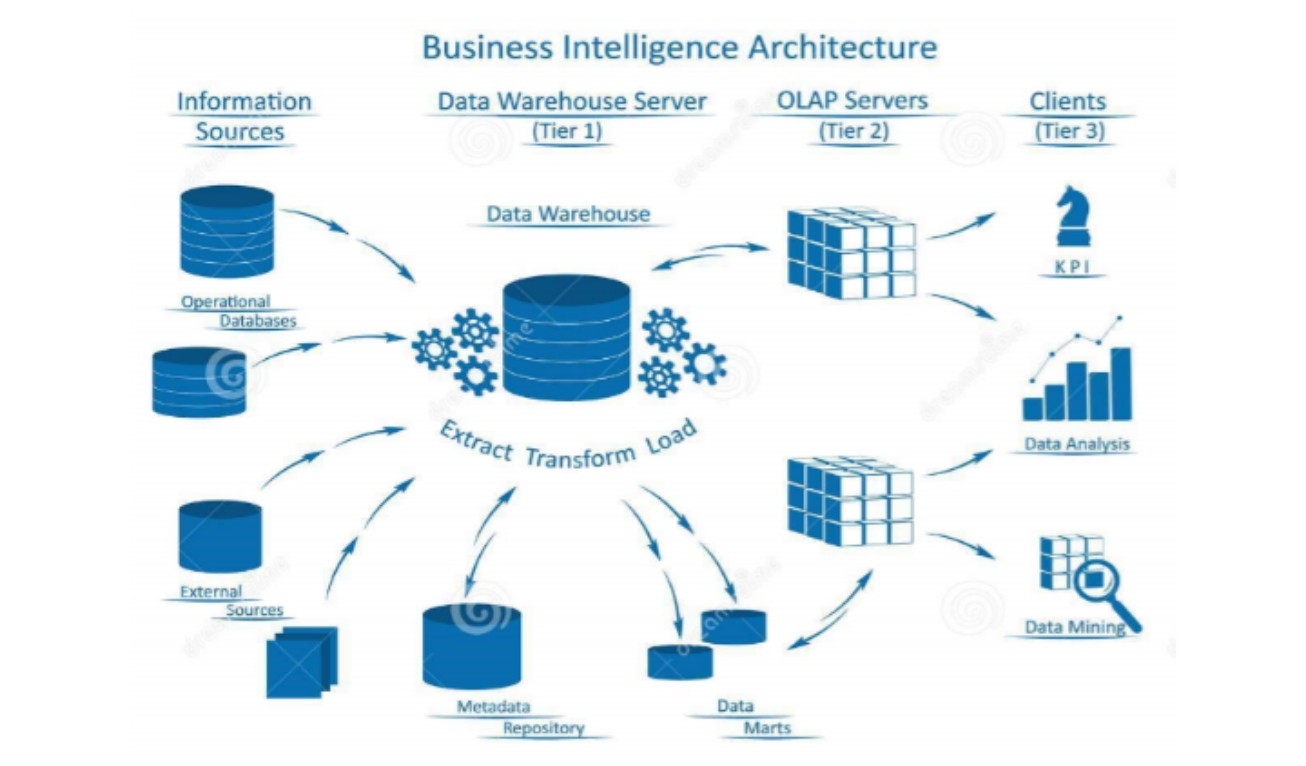
BI Architecture:
It also helps to understand the Business Intelligence architecture before understanding Cloud Business Intelligence (Cloud BI) deployment.
A Business Intelligence architecture is a blueprint that provides short instructions onyou’re your organization will work its BI initiatives. In other words, BI architecture defines the technology quality, data management, and analytics practices which support your business’ BI efforts, as well as the platforms and tools that will be deployed. The BI architecture is important to prevent gaps in BI implementation as your enterprise tries to utilize data better.
This is a typical Business Architecture diagram for Business Intelligence (BI):
-
Data Management: Data management means how data is collected,
stored, and accessed. It occurs at all levels of the organization, like data collected by seniors
and then entered into databases by employees. The goal of data management is to ensure that data is accurate
data secure, scalable, and easily accessible to those who need it.
-
Data Analytics: Data analytics is the process of transforming data into insights.
By using this any organization can gain a better understanding of their employees, their customers, performances,
and trends that are shaping their industry.There are three types of data analytics;
- Descriptive: What happened in the past?
It describes past events and trends.
- Predictive: What will happen?
It predicts future events and trends.
- Prescriptive: What action do we need to take?
It prescribes what your company should do to improve business performance.
-
Technology: To do data management technology is required.
By using technology we can also share our insights with other organizations.
- Data Warehouses: A data warehouse is a database that is designed for storing and analyzing huge
volumes of data. Data warehouses are used by businesses to store their data in a single location so that it
can easily be accessed and analyzed.
- Data Lakes: Data Lake is a repository that can be used for storage and analysis. Data lakes are
often used by businesses to store unstructured or structured data.
How does Cloud BI work?
Cloud BI entails hosting and operating Business Intelligence (BI) tools either fully or partially within a cloud environment,
on a virtual network. This facilitates access to BI-related data like dashboards, KPIs and comprehensive reports from any location,
ensuring that executives do not need to be present in office all the time to be able to gain data-driven insights.
Cloud BI Deployment Model:
The Cloud BI deployment model combines a specific type of cloud environment based on ownership, scale, and access.
It describes how cloud infrastructure will look, what will change, and will have to create everything in the cloud by yourself.
Cloud deployment types are the relationship between the infrastructure and users.
-
Public Cloud: A public cloud expenditure is affordable Cloud BI because the cost of the
infrastructure of cloud bi is split into various cloud tenants.
-
Private Cloud: A private cloud is the most expensive deployment model but has enough storage
and computing resources as needed. It is used for organizations that have data security and regulatory compliance.
-
If you’re a business user with low coding knowledge, No-code low-code (LC/NC) platforms
will offer you an opportunity to make changes in applications developed using this method. In this respect, the
most potent use you can make of applications developed using LC/NC is to easily automate your business processes.
Composite applications can also be developed with the help of NCLC platforms.
-
Hybrid Cloud: Some organizations use a hybrid model. They may have certain data which is strict regulations and other data
is not. The hybrid model allows the most sensitive data to store and analyse in a private cloud and work with the
rest of other data in the public cloud.
Why Cloud BI makes more sense in 2023
-
Easy to Deploy: We know that Cloud BI solutions are based on the internet,
so they can install quickly and are simple enough for the team because they don’t need to depend on IT experts.
-
PIntuitive Design: Cloud BI dashboards are easy to use; by this, any stakeholder can
navigate data insights and make appropriate decisions.
-
Automatic Updates: Cloud BI has a feature to update software automatically and then
implement new features. It doesn’t need any physical hardware updating. So, by this latest and greatest features
then & there available to the users.
-
Mobile Access: Since rising of remote work, it’s impossible to have longer access to on-site and desktop computers
for stakeholders. By using their BI solutions, like DOMO, they can easily access from anywhere to any device.
-
Cost Savings: Very few on-site servers and IT staff are needed
to maintain and manage the BI process, Cloud BI uses to reduce cost.
-
Scalable Resources: Cloud BI can scale up & down as per the organization’s requirements.
It is easy to handle huge amounts of data. It can compute too.
-
Stay Competitive: Cloud BI is affordable means that any size of company can
access the features of better business intelligence.
-
Share Securely: By using of cloud bi proper data can share secure insights with team members.
-
More Accurate Data: Cloud BI tools can process and as well as recheck data anytime.
BI Tools your company could use
Data discovery is not so easy to use but by using BI tools anyone can do it at any level.
Here we will discuss 5 top BI tools.
-
SAP Business Object: SAP business intelligence is a centralized platform that offers
comprehensive reporting, analysis, and interactive data visualization.
-
Data Pine: Data pine was founded in 2012. It is an all-in-one business intelligence platform
that empowers everyone to explore, visualize, and facilitate, complex processes of data analytics and share data even with
non-technical users.
-
Micro strategy: It is an example of a business intelligence tool.
It is the enterprise analytics platform built for powerful dashboards, cloud solutions, and hyperintelligence.
-
SAS Business Intelligence: SAS business intelligence is an advanced predictive analytics platform that is a
cloud-based enterprise that allows users to manage interactive reports and track merits.
-
Yellowfin Business Intelligence: Yellowfin is an end-to-end
analytics platform. From connecting to preparing your data to building dashboards and preparing reports.
-
Scalable Resources: Cloud BI can scale up & down as per the organization’s requirements.
It is easy to handle huge amounts of data. It can compute too.
-
Stay Competitive: Cloud BI is affordable means that any size of company can
access the features of better business intelligence.
-
Share Securely: By using of cloud bi proper data can share secure insights with team members.
-
More Accurate Data: Cloud BI tools can process and as well as recheck data anytime.
Power BI & Tableau – The Top Two Cloud BI Software:
Microsoft Power BI
Microsoft Power BI offers a plethora of options to help you integrate, visualize and analyze the data produced
by any or all of your business processes and visually represent the data on a dashboard for ease of decision-making.
Since Power BI operates on the cloud, dashboards can be accessed collaboratively by various stakeholders in your organization
for more effective decisions.
Power BI can integrate data not only from spreadsheets and CSV files but also from data warehouses.
Microsoft Power BI is very intuitive and user-friendly, so all sorts of users, including users with
low technology exposure can use the software to process and interpret data on the cloud.
Tableau
Tableau can integrate into many different sources of data at your company, including spreadsheets,
PDF documents, CRMs, ERPs as well as AWS (Amazon Web Services) sources. The data is then processed
and fed into your dashboard for rendering sharable visualizations . Tableau Server is an enterprise
platform that supports every step of your organization’s data analytics processes on the cloud.
It includes organization-wide data governance, data analytics automation and data security support.
Why BI Software is replacing Microsoft Excel in enterprises:
While some businesses might still be clinging to Excel, those innovators are bringing in superior BI software,
for good reason. Here are a few:
-
Enhanced capacity:
Microsoft Excel can’t handle complex operations effectively.
If you’re working on a spreadsheet file with too much information,
the document won’t open or will come up with error messaging. Alternatively,
BI software can merge huge quantities of data which can’t be opened in Excel.
-
Opportunity for collaboration::
Because Microsoft Excel is designed for use on a personal computer,
it doesn’t offer multi-user capabilities, making it challenging for employees to
work on one spreadsheet. However, BI software will allow for collective input, which means
real-time input and modifications. Employees can even access the software from mobile devices
with automatic alerts.
-
Task automation:
Modern BI software will automatically collaborate and refresh data which means there is no need to be
dedicated to this task. This is great at minimizing human error which is common in Microsoft Excel,
leading to massive financial implications.
-
Integration with cloud services:
While Microsoft Excel integrates with other Microsoft technologies, it is limited beyond this reach.
However, BI software – because it is cloud-based – can merge with various other software solutions,
extracting pertinent data and leveraging better business insights.
-
Yellowfin Business Intelligence: Yellowfin is an end-to-end
analytics platform. From connecting to preparing your data to building dashboards and preparing reports.
-
Complex visuals:
Microsoft Excel is bound to visualization, and making visuals takes a lot of time and effort.
BI software will easily extract relevant data and automate unbelievable reports and visualizations
in a minimal amount of time. It can combine the data onto a centralized dashboard, for ease of use.
-
Customised content: BI software can make live dashboards with interactive
reports customized to your particular business. In addition, BI software offers users a QA feature that
allows for the quick search of common phrases using general language code.
-
Trends and forecasting: Software BI allows for the easy analysis of trends from huge amounts of
business data. This can then be used for predictive business forecasting according to a weekly, monthly,
or annual estimate.
-
Increased security: Most BI software will provide you with superior security features that grant
limited access to certain elements of the software. Because of the value associated with business data,
superior security must be combined with advanced access control.
How does Business Intelligence Visualization Look on Cloud-Based BI Dashboards?
Finally, if you would like an idea of how all your data looks after processing and rendition into a visual format,
let’s talk about BI dashboards. A business intelligence (BI) dashboard is a data visualization & analysis dashboard
which allows users to track, analyze & display reports on key performance locators and other metrics.
Why do we need BI Dashboard?
As we know that BI dashboards are visual information tools organizations use to represent data and convey information
efficiently. There are some major benefits of BI dashboards:
-
Saving BI time:
Updating existing data, dashboards, and reports, and building new ones is one part of it.
Another part of it is interpreting the data, spotting trends, raising red flags, etc.
With a dashboard set to perform automatic updates, the BI team spends far less time
producing and maintaining the dashboard. They can then utilize the time saved on other projects or analyze data more.
-
Empowering end users:
There is another aspect of time-saving benefits connected to dashboards.
In addition to improving the productivity of those building dashboards,
BI dashboards can help increase the productivity of end users.
A BI tool as simplified and clear as a dashboard empowers end users to manipulate data and get answers more efficiently.
-
Improved efficiency enabled by BI software:
Depending on which BI software a business uses, it can reap benefits from any extra features it may have.
This is particularly useful when the features provide more efficiency.
-
Bringing data together:
Typically, BI dashboards benefit businesses by tracking processes from beginning to end.
This holistic approach means dashboards often rely on data from different locations.
Dashboards are a good place to bring together all available data sources.
This way, organizations can establish relationships between the data they collect and analyze it all as one.
-
Focusing on KPIs:
Dashboards are built to provide quick insights into some of the most important business processes.
Dashboards work best if the information they contain is to the point and instantly visible.
The dashboard-building process begins with determining its purpose and the key performance indicators involved.
KPIs are crucial metrics for the evaluation of a business process.
-
Improving the decision-making process:
Simply put, the purpose of BI is to answer two main questions. First, "How well are we doing?"
and second, "What do we do next?" These questions can be about the business as a whole or segments of it.
"What do we do next?" is always followed by a decision. This is precisely the purpose of a dashboard.
It is meant to provide answers to numerous questions with the single goal of making an informed decision.
-
Telling trends:
With the requirements set and met, a dashboard gives insight into the well-being of a business.
It is a form of quick business news for an organization.
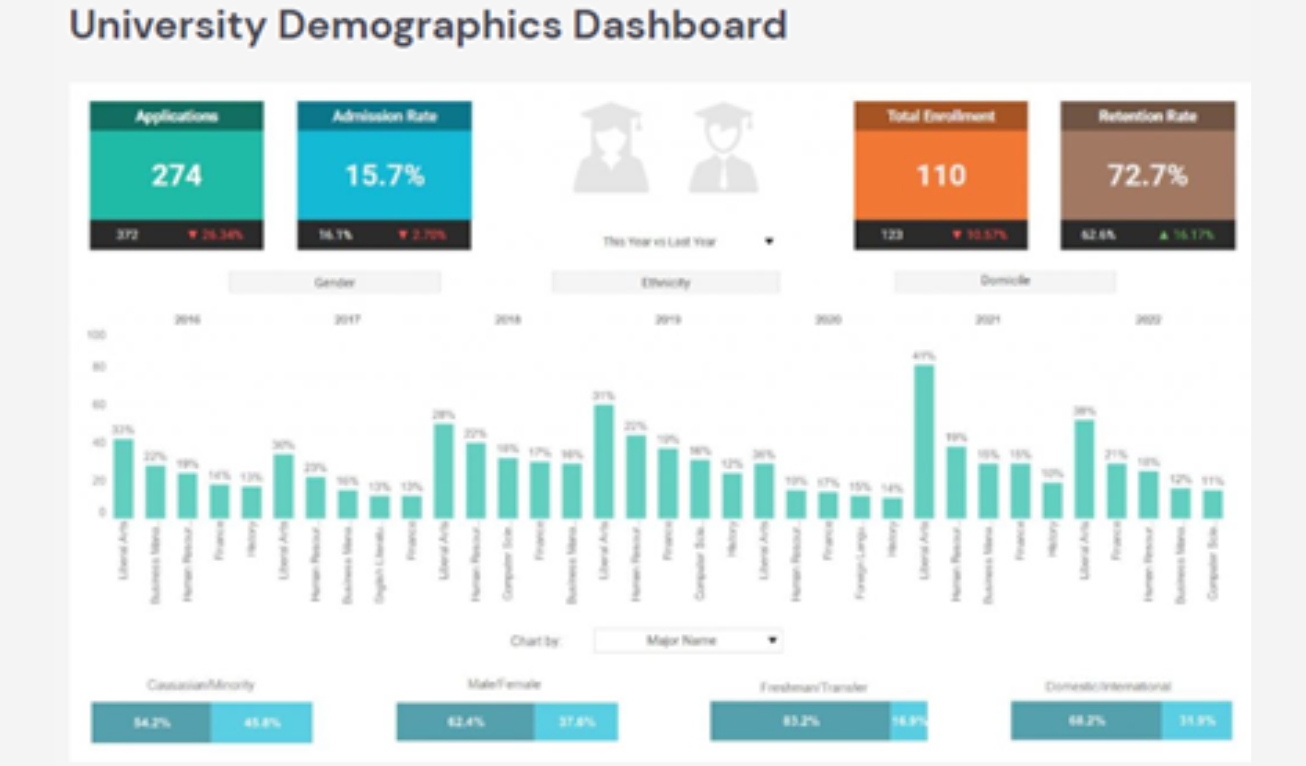
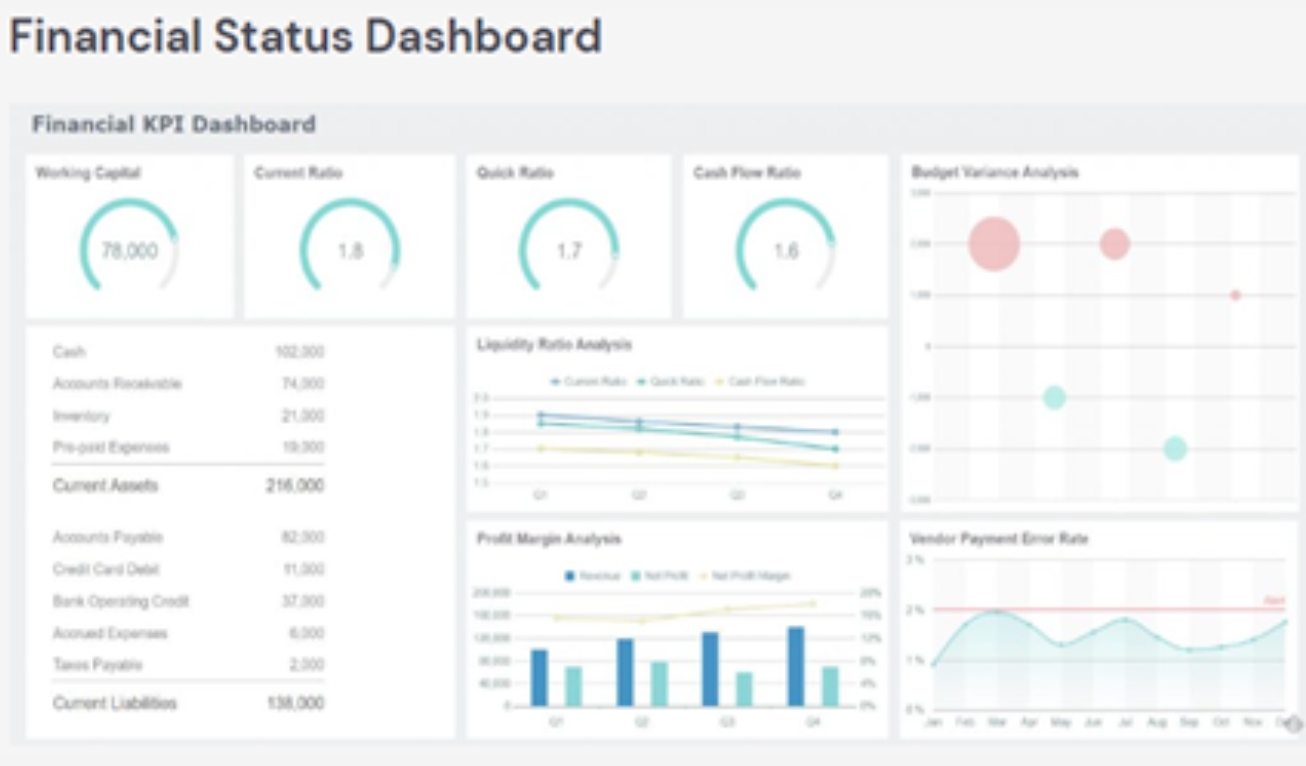
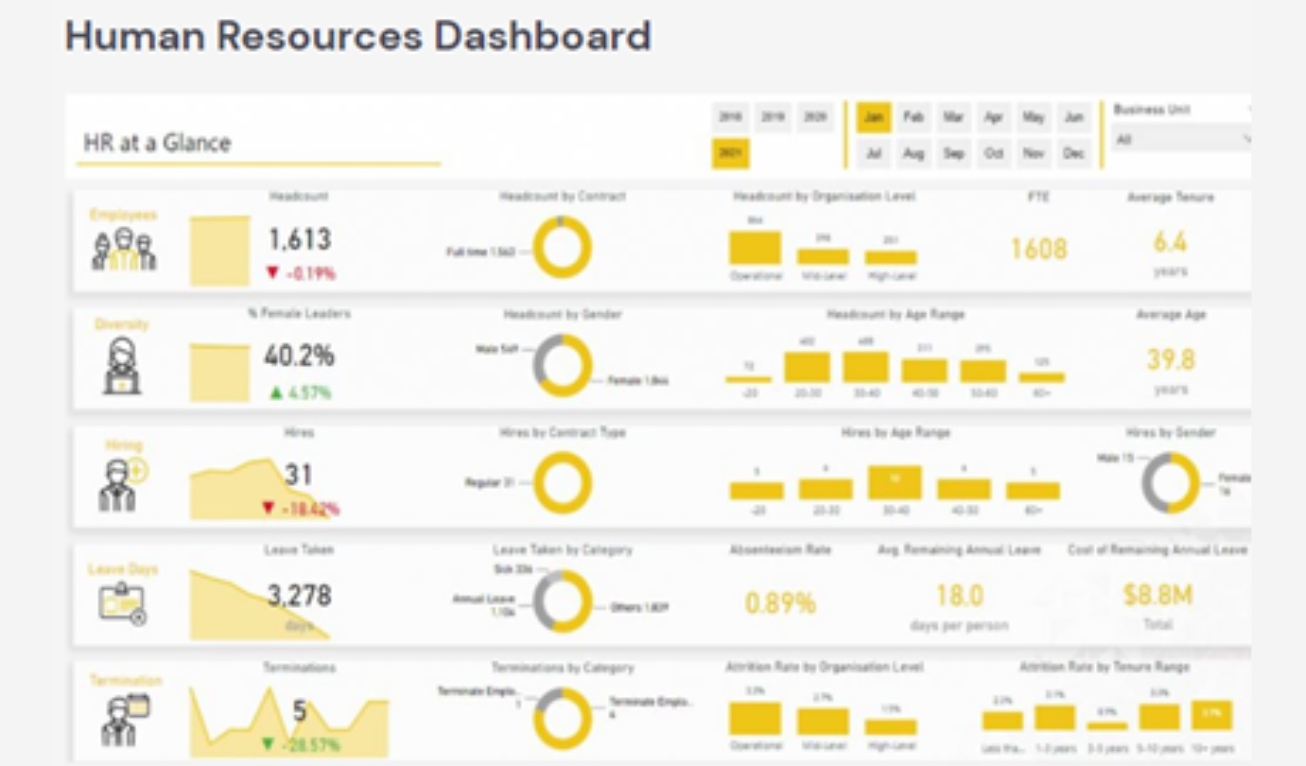
We’d like to end this blog with a few brilliant BI dashboard examples from various industries and verticals.
BI, especially Cloud BI, is truly a universal business tool for extracting the most out of business data.
Find out how Cloud BI can be integrated into your organization’s existing processes and tools by setting up a
free consultation with AchieveX’s experienced team of data scientists and data analysts.